UX Design

Public Transit Tracker

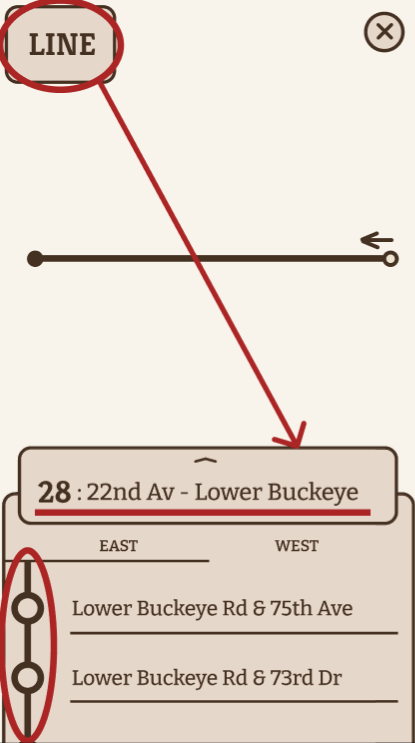
Intuitively navigate between two sets of data: bus lines and stops. Organized searchability and live, interactive map.

Overview

The client is a transportation agency for a midsize metropolitan area in the Midwest.

Riders want to know when the next bus will arrive at each stop and how much time they have to get to the bus stop.

The mobile app "Track" was created to effectively display accurate and real-time bus line information.
Problem: Current design does not organize information visually nor allow the user to explore.

Goal: Convert current site layout to a landing page with a calendar feature.

Audience: Improvisers within the local community, with potential outreach to the greater art scene.
Timeline: 3 weeks (September 2022)

Role: Solo UX/UI Designer + UX Researcher

Responsibilities: UX Research, Prototyping, Usability Testing

Deliverables: High-fidelity clickable prototype of search & display screens for public transit schedule.
Timeline: 3 weeks (October 2022)

Role: Solo UX/UI Designer + UX Researcher

Responsibilities: UX Research, Prototyping, Usability Testing

Deliverables: High-fidelity clickable prototype of homepage and calendar page screens with MVP functionality.

Discover

User Research

Methods:
I conducted a user survey with 17 responses, and then conducted a follow-up interview with one of the participants.

Findings:
My research revealed the audience for this project is not people unfamiliar with the public transit system, but rather those who are familiar with the system and rely on accurate and easily searchable information for their everyday life.
Methods:
I conducted a user survey with 6 responses along with an in-depth conversation with the client about their user base.

Findings:
My research revealed the typical improviser needs a lot of self-initiative to stay involved & informed as the local community is decentralized. There is an opportunity to encourage centralizing information.
Pie graph displaying how often people use public transportBar graph displaying concerns with public transport

Market Research

Strengths: Comprehensive information; playful style. Opportunities: Cluttered layout; overwhelming color scheme.
Table displaying similar characteristics of other public transit mobile apps.
Methods:
I generated a competitive analysis of both agency-specific and general transit mobile applications.

Findings:
Most categorized by trips (or destinations), lines, and stops (or stations) and had a homepage of a live, active map.
Methods:
I generated a competitive analysis of two other websites for improv theatres.

Findings:
Strengths - comprehensive information; playful style.
Opportunities - cluttered layout; overwhelming color scheme.

"How Might We...

... relay accurate arrival times so riders won't miss their bus?”
… organize bus lines and stations so users can easily search for the information they need?”
... reach all communities of varied proximity to improvisation?”
… draw in students who like to play big and boldly?”

Define

User Priorities

A user persona graphic that displays a users goals and needs.

High-Priority User Stories:

1. I want to know when my bus is arriving at the Washington & State bus stop, so I can calculate how much time I have to reach the bus stop.
2. I want to know the next bus arriving at the Washington & State bus stop, so that I don’t rush to the bus stop if it is not my bus.
3. I want the ability to view future arrival times for any of the seven bus lines (serving Washington & State), so that I know when my bus arrives.

User Flow

A flow chart for the project mobile app.

MVPs

1. Ensure that any rider can tell when each of the buses arrives at the Washington & State bus stop.
2. Ensure that all riders can tell how much time they have to get to the Washington & State bus stop before the bus they need arrives at that stop. 
3. Allow riders to select one of seven bus lines to see a list of its future arrival times at the Washington & State bus stop.

Develop

Wireframing

Sketch Ideating

Design Thinking:
To highlight the playful and bold branding, I wanted the homepage to focus on the character and personality of the logo. To streamline the calendar page, I wanted to provide multiple options to search for upcoming events.

Brand Development

Lo-Fi Prototyping

Paper to Digital Prototyping

Deliver

Usability Testing

Findings - Homepage:
- Pleasing design.
- Design doesn't indicate animation.
- Navigation bar at bottom of viewport implies there is more content below-the-fold - there is not.
Findings - Calendar Page:
- Easy to find upcoming shows & classes.
- Carousel layout doesn't encourage scrolling usage.
- Filter section not noticeable.

Refining Prototype

Changes: Created a hover state for the logo, so users know to click. Moved navbar to top of the viewport, so users know there is nothing below-the-fold.
Changes: Adjusted display of carousel view to cut off card, so users are prompted to scroll. Adjusted UI of filter options with larger, heavier text to better draw attention & adjusted dimensions of checkbox to a square.

Hi-Fidelity Prototype

Debrief

Successes & Lessons

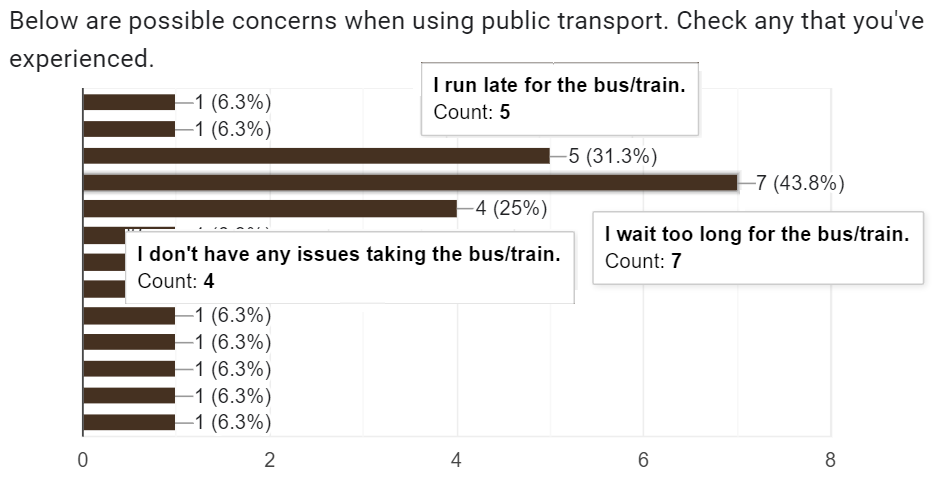
Working with Imperfect Data: Scheduled bus times are rarely accurate, as things like traffic or taking a bus out of service for maintenance can impact the schedule.

The Power of Data Interactivity: “It was easy to navigate between the two sets of data, lines & stops.”

The Value of UX Research: “It’s less about creating and more about understanding the problem so well that the solution is obvious.”

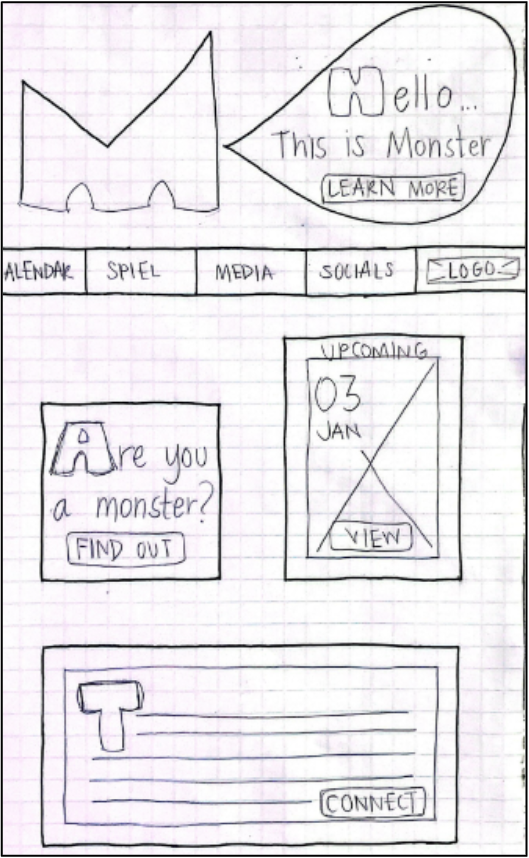
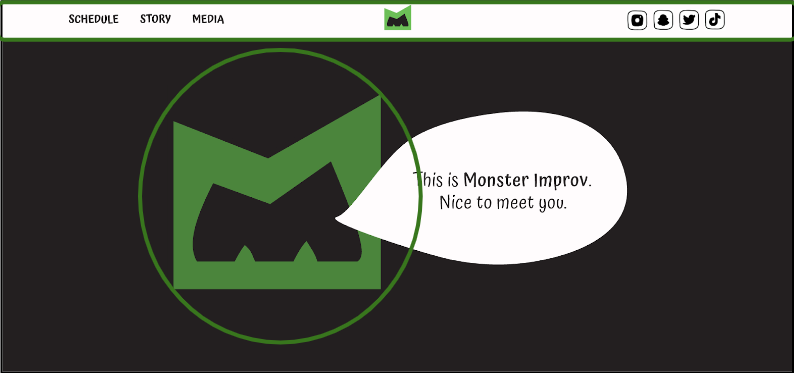
Understanding the Client: As important as defining the constraints of your specific product is connecting with their larger vision for their business and dreamed long-term goals to effectively portray the brand through your design.

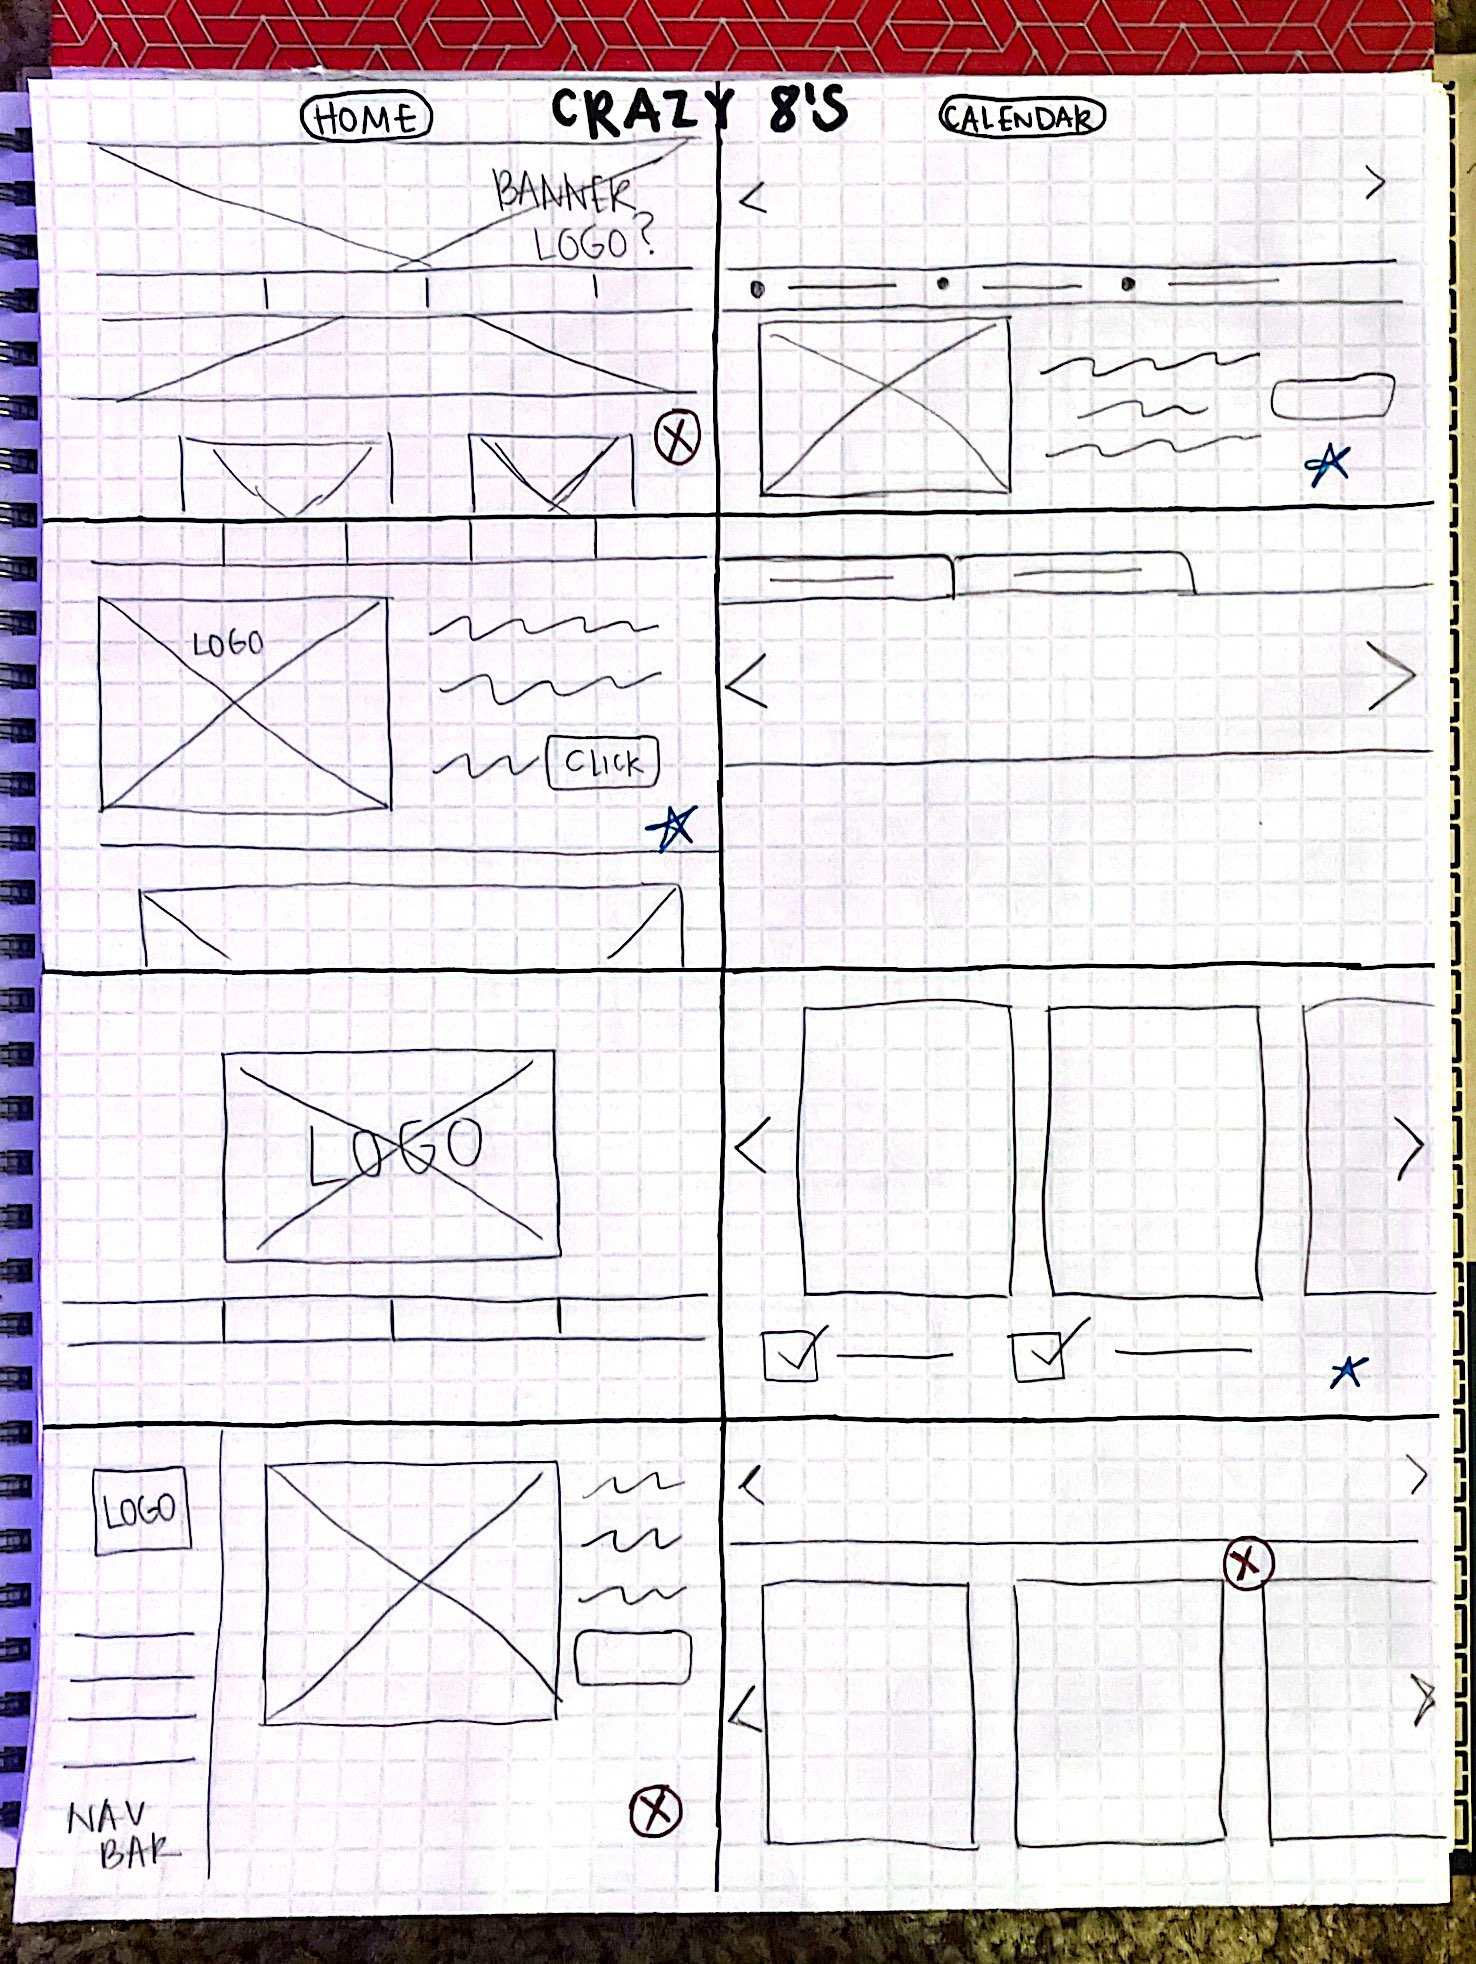
The Power of Ideation: Rather than commit to the first design solution that 'works', explore until you can answer why you are committing to the design solution.

Researching Users That Don't Exist (Yet): Define user motivation(s) and frustration(s) through market research and archetypes. This will serve as a foundation, which you can revisit and edit later.

Next Steps

Flow: Iterative Interactions

Screen: All Possible Lines

From the Homepage:
- Complete navigation bar and build necessary pages.
- Add speech bubble taglines/calls to action.

From the Calendar Page:
- Build page/design for "reserve" function (3rd party link or internal page?).
- Revise or remove filter option feature.

CONTACT
E-mail Address
LinkedIn
alishaphx@gmail.com